Hi, this is JamJam writing again on the more technical side of development. This time the topic is about memory usage, more specifically about how to debug (and hopefully fix) it. This is again a more technical/tutorial type of blogpost that is targeted more for intermediate programmers. Lets begin!
Debugging basic memory usage:
First of all, always remember to debug the builds, not the editor. Unity editor has all sorts of garbage and overhead and would result in inconsistent data. In the picture below I’m using just the basic Unity profiler to see what’s in our memory after loading the first level.
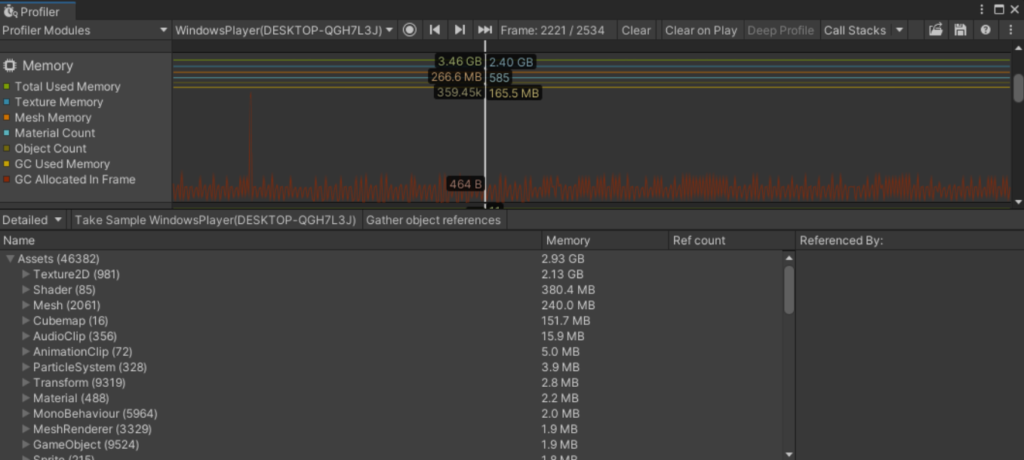
Using the basic detailed profiler is helpful mostly when looking at garbage causes and checking overall memory usage. For searching the heap on what is stored in the memory and why, this does not help us that much. In our case, we are running out of memory between scene changes, so we need to dig deeper into that.
Insert memory profiler. I won’t go into much detail on how to install the memory profiler, but you can check that (and some more additional info) in here.
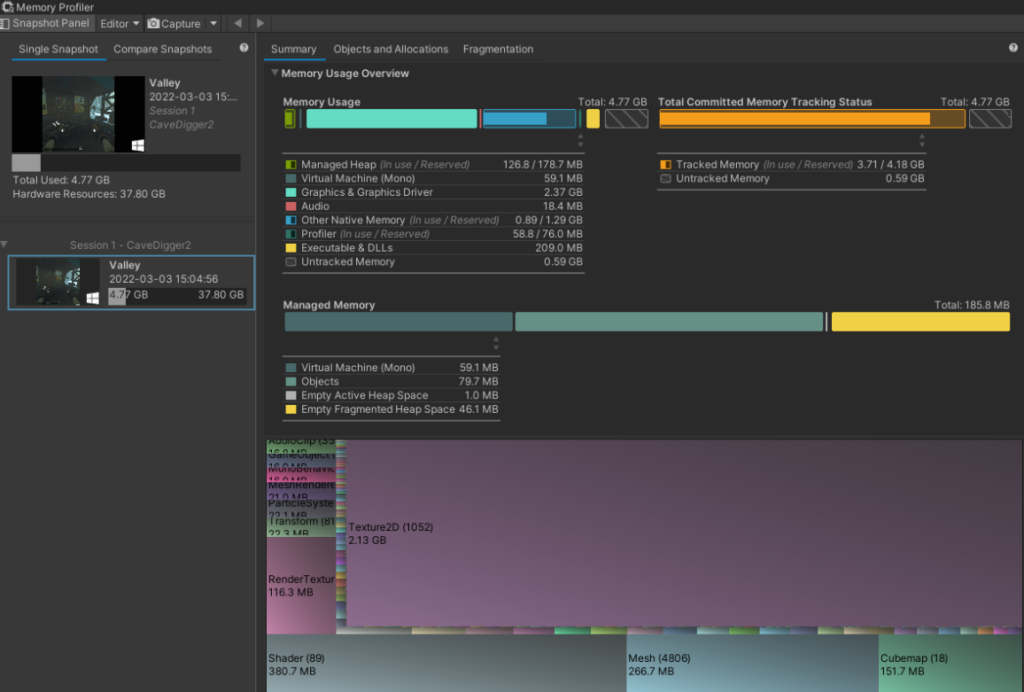 Snapshot of our valley memory
This is where we can see the basic memory usage and what is being used. I’m profiling our PC build, so having so much allocated memory overall is not that much of an issue.
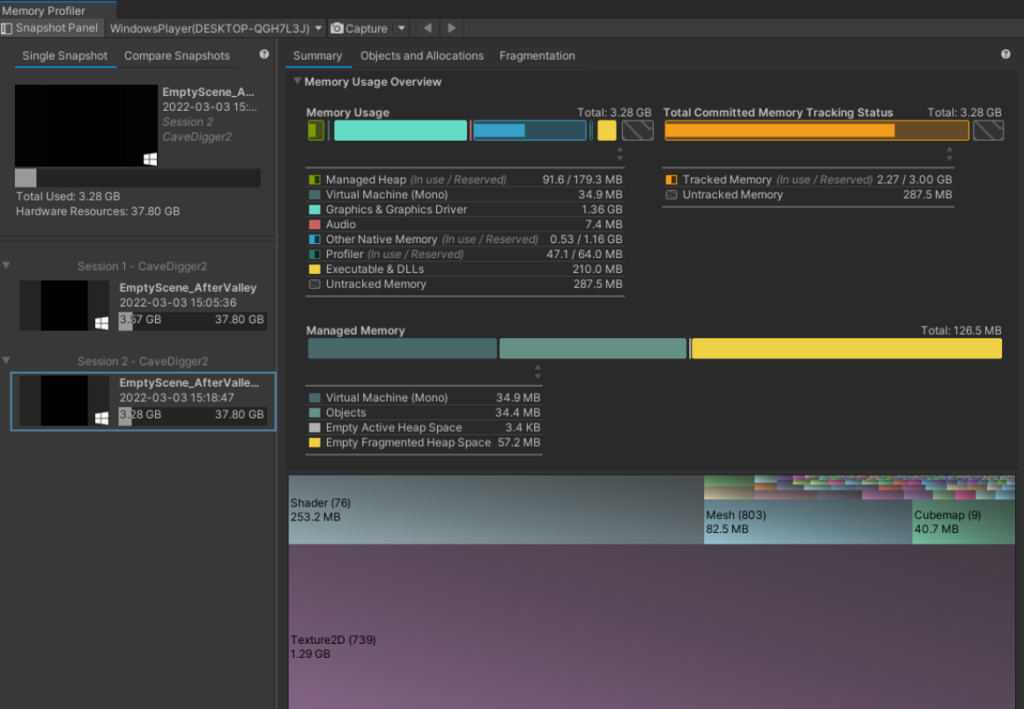
How does this help us to find memory leaks and problems? For that, we need to start the game on an empty scene, load our basic game scene, and load the empty scene again. By doing this, we’ll get a snapshot of the empty scene, and it should have a very low memory footprint if everything is unloaded correctly.
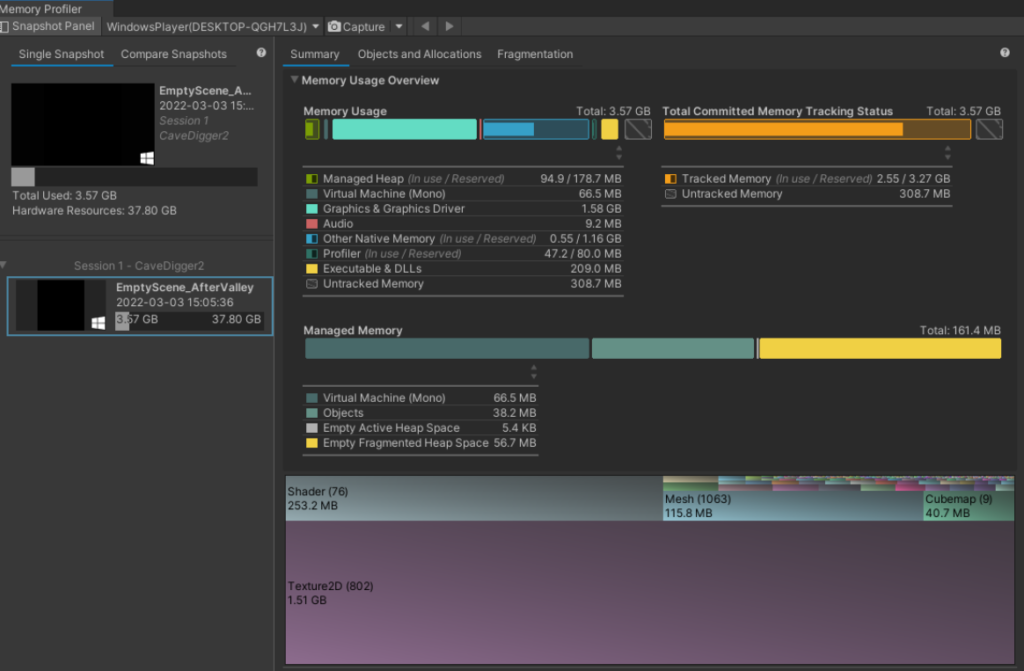
Memory after loading valley and then loading an empty scene
Woah thats a lot of assets still in the memory. We have our player avatar stored on the DontDestroyOnLoad, so some of that might be acceptable. Let’s for example inspect the textures left in memory.
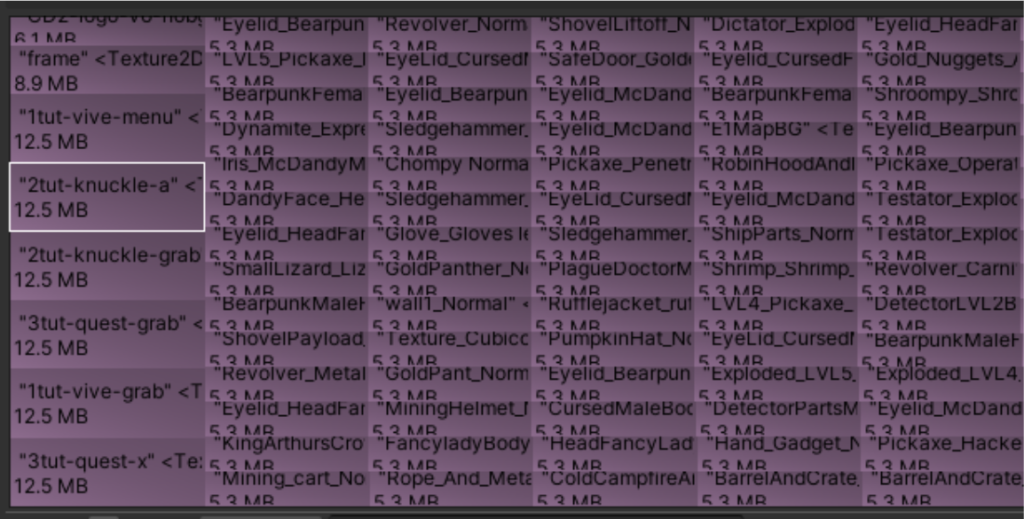
As I suspected, we have essential items like player textures that are ok. Some of these seem to be tool textures, which I don’t really mind, since in a real world situation we’ll have all tools available on all scenes anyway. But the “2tut-knuckle-a” should be Valley scene specific, and it should be removed from the memory after scene changes. Let’s dive deeper into that. On the references panel, we get an insight on what might be the problem.
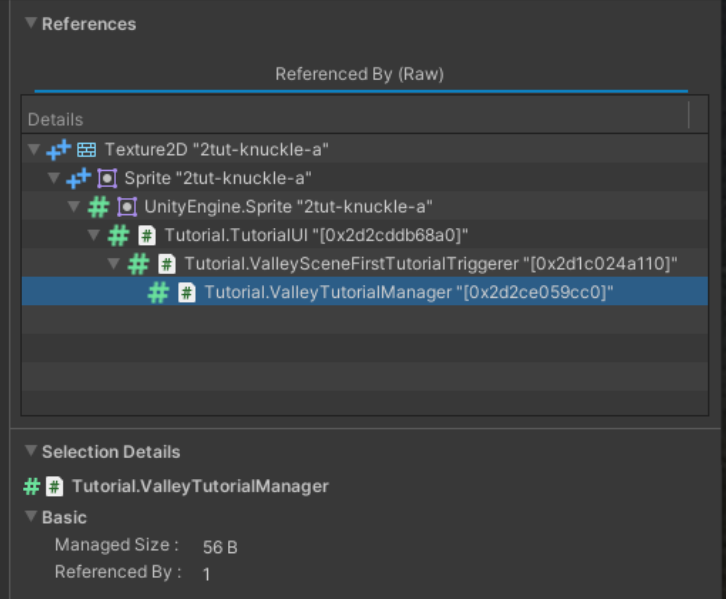
So, the texture is called by the TutorialUI script, which is called by the ValleySceneFirstTutorialTriggerer, which is called by the ValleyTutorialManager, which definitely should not be in the memory, weird. Let’s take a peek at the code side.
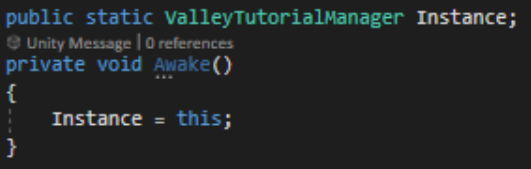
Okay this seems to be a problem. The manager is making a static instance of itself for easier referencing, which is never destroyed. So it basically holds all of it’s referenced components in memory, since it might need them. This creates a snowball effect that holds our tutorial UI texture in memory. Simply making the manager a null instance should solve the problem.
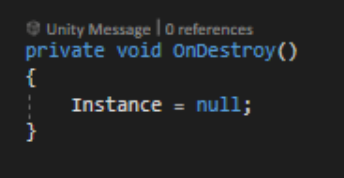
Nice, almost 300MB reduction on memory usage by adding just a couple of lines of code. Seems like all of our tutorial UI graphics were held in the memory for the same reason.
This of course is just one part of checking our memory, and all games are different. But this might help you to get an insight on how to approach memory problems on your own.
Until next post
– Jammu
Random development quote: “Anna Juho palaa! Refaktoroi 800 riviä hissikoodia! -Jammu, se on 995 riviä.”